HOTSPOT -
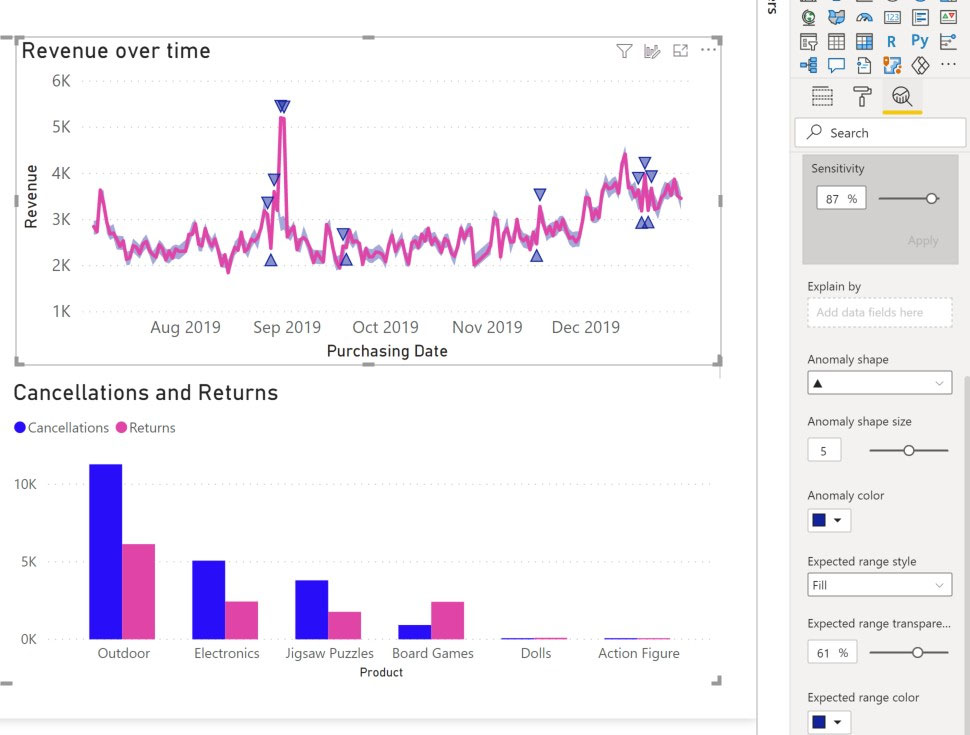
You have a Power BI visual that uses indicators to show values that are out of range as shown in the following exhibit.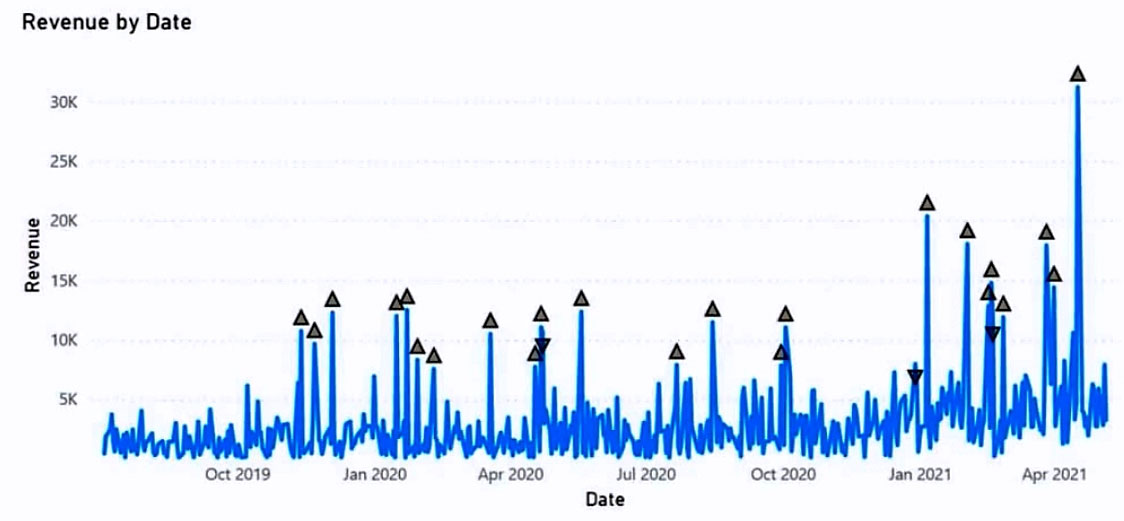
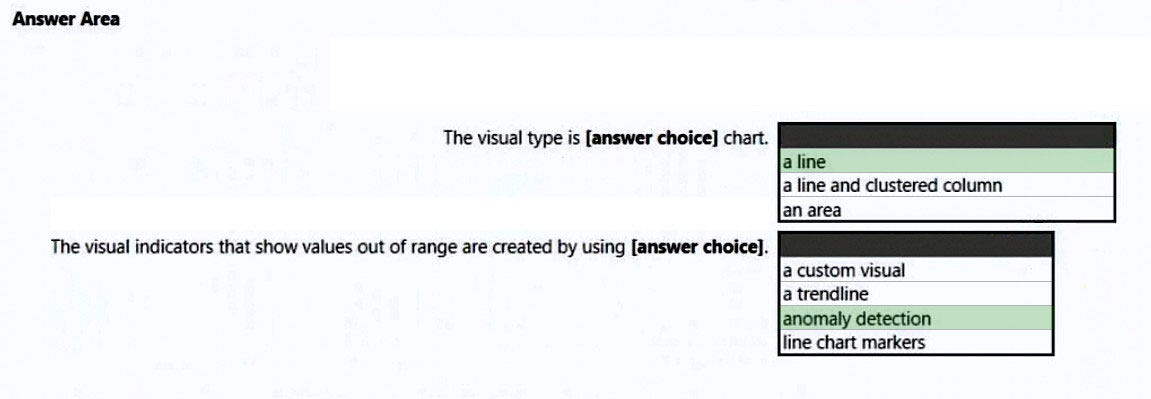
Use the drop-down menus to select the answer choice that completes each statement based on the information presented in the graphic.
NOTE: Each correct selection is worth one point.
Hot Area: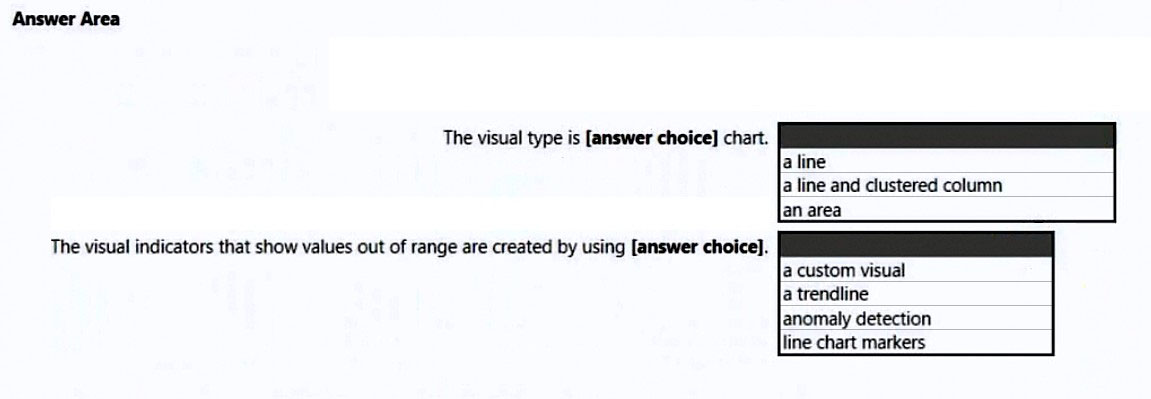

dorypl300
Highly Voted 2 years, 6 months agoPaweuG
Highly Voted 2 years, 2 months ago00c7ee4
Most Recent 8 months, 1 week agorcaliandro
8 months, 1 week agoJudT
1 year agolukelin08
2 years, 5 months agolouisaok
2 years, 5 months agoBooster21
2 years, 5 months ago