DRAG DROP -
You are creating a Power BI model and report.
You have a single table in a data model named Product. Product contains the following fields:
✑ ID
✑ Name
✑ Color
✑ Category
✑ Total Sales
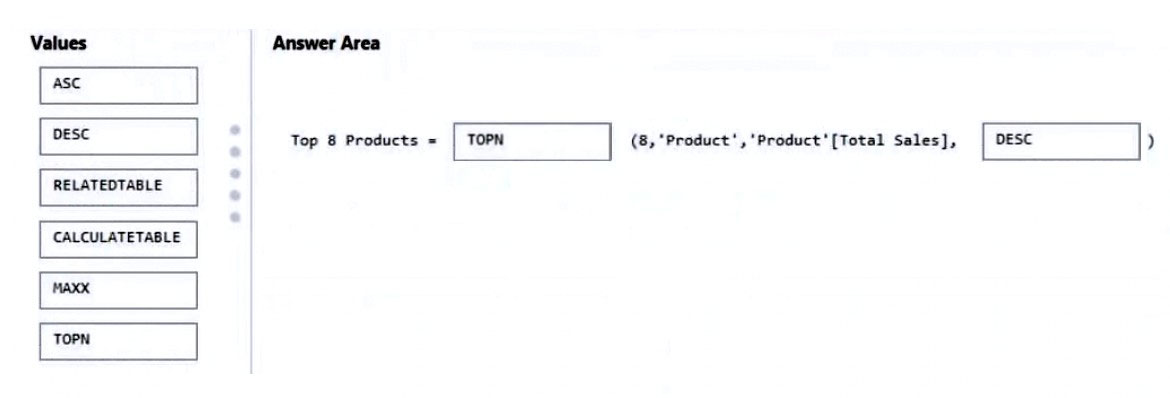
You need to create a calculated table that shows only the top eight products based on the highest value in Total Sales.
How should you complete the DAX expression? To answer, drag the appropriate values to the correct targets. Each value may be used once, more than once, or not at all. You may need to drag the split bar between panes or scroll to view content.
Select and Place: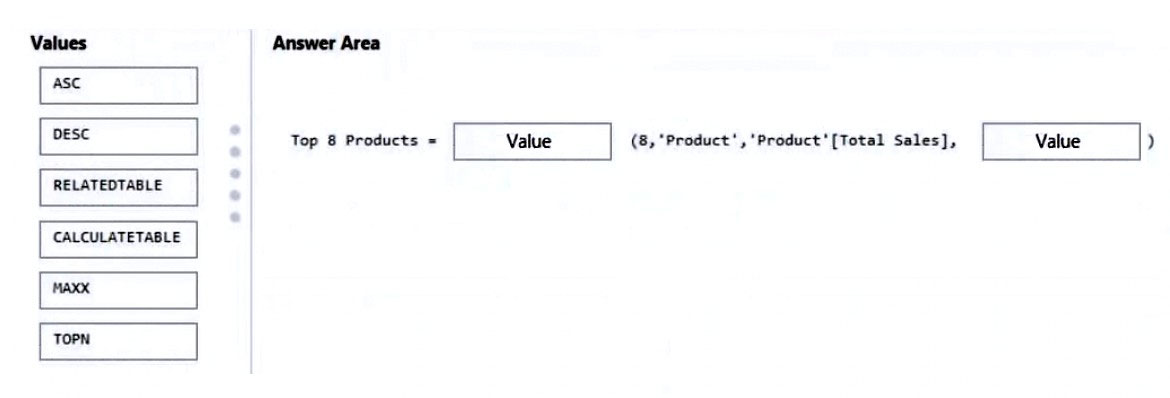

Namenick10
Highly Voted 2 years, 7 months agogtc108
Highly Voted 2 years, 6 months agorcaliandro
Most Recent 8 months, 1 week agorcaliandro
8 months, 1 week agoIgetmyrole
1 year, 7 months agorgabage
1 year, 8 months agoLambdaBld
2 years agoRazaTheLegend
2 years agovishal10
2 years, 4 months agoiccent2
2 years, 4 months agoreyn007
2 years, 4 months agolukelin08
2 years, 4 months ago