HOTSPOT -
You are creating a line chart in a Power BI report as shown in the following exhibit.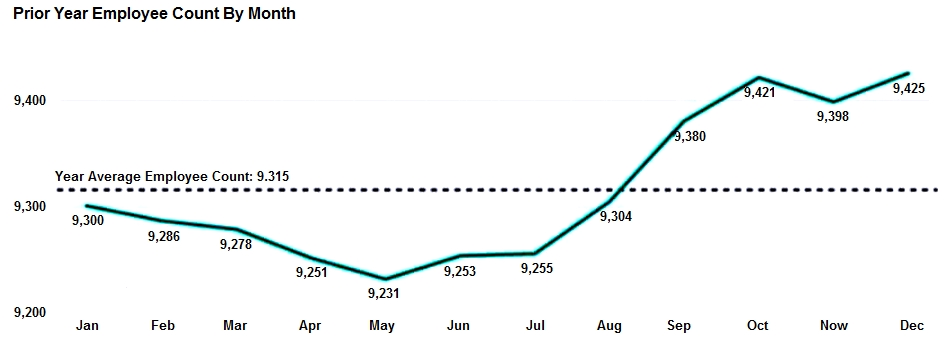
Use the drop-down menus to select the answer choice that completes each statement based on the information presented in the graphic.
NOTE: Each correct selection is worth one point.
Hot Area: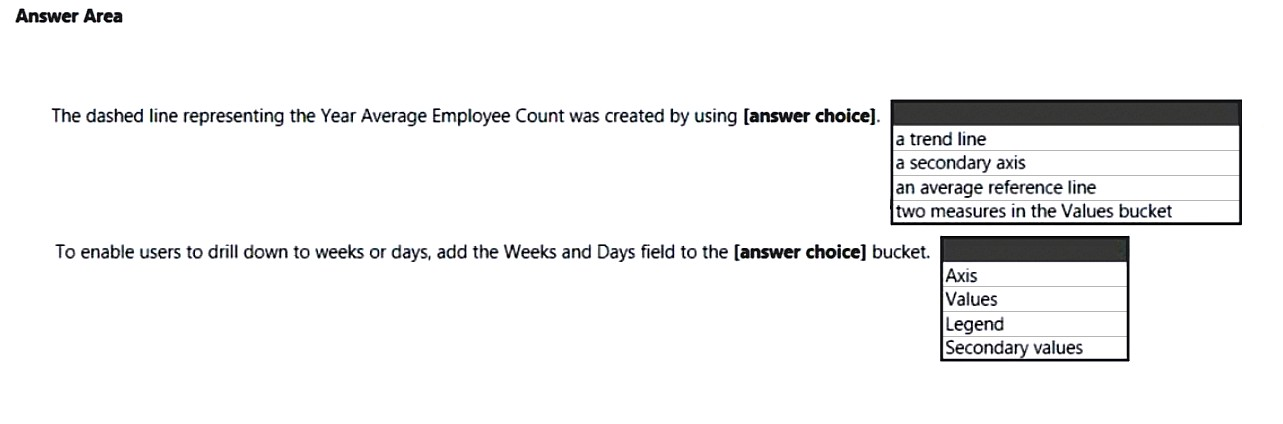


emmanuelkech
Highly Voted 2 years, 7 months agoMizaan
2 years, 6 months agopowerbibuddy
2 years, 5 months agobdub1976
1 year, 4 months agonikfed
Highly Voted 2 years, 7 months agojaume
Most Recent 5 months, 1 week agorcaliandro
8 months, 1 week agoDani_eL
1 year, 1 month agodeyoz
1 year, 4 months agoSuniltheMentor
2 years agosrikanth923
2 years, 1 month agoPaweuG
2 years, 2 months agoAzureJobsTillRetire
2 years, 4 months agoMati_123
2 years, 4 months agoMati_123
2 years, 4 months agolukelin08
2 years, 4 months agorjramyyyy
2 years, 5 months ago