HOTSPOT -
You have a column named UnitsInStock as shown in the following exhibit.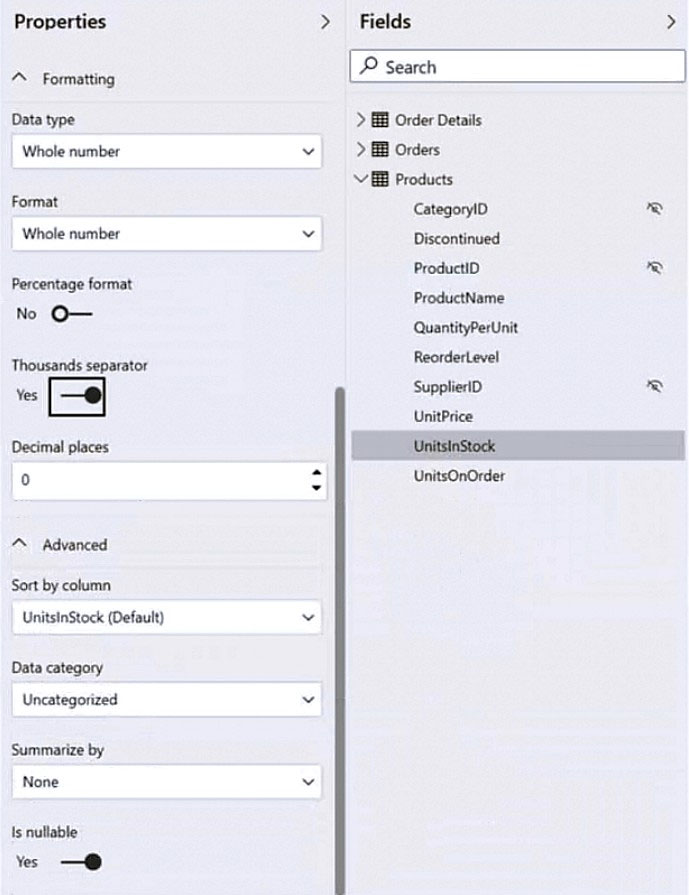
UnitsInStock has 75 non-null values, of which 51 are unique.
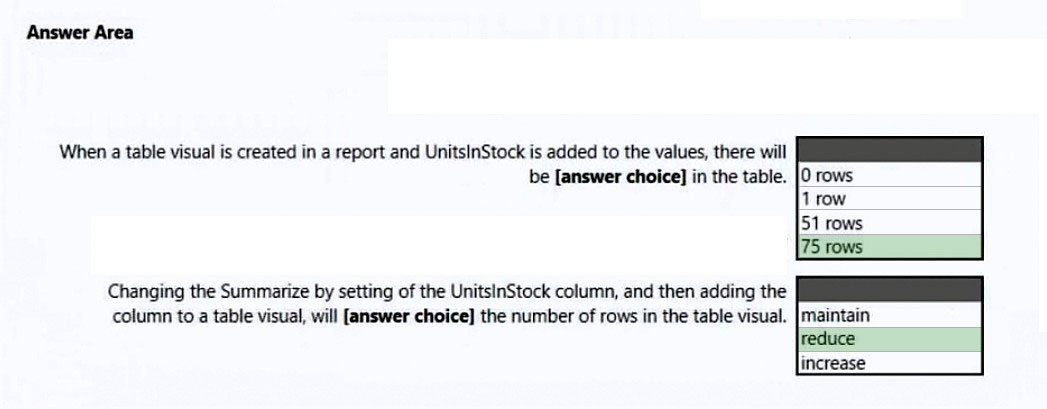
Use the drop-down menus to select the answer choice that completes each statement based on the information presented in the graphic.
NOTE: Each correct selection is worth one point.
Hot Area: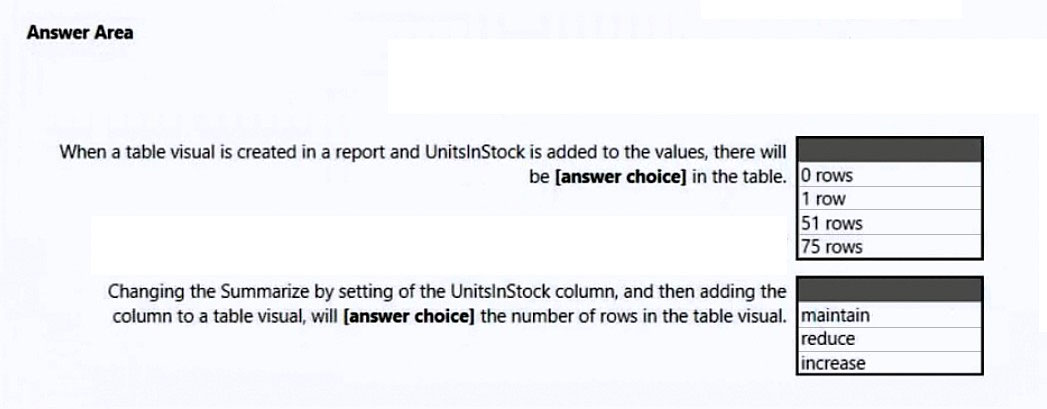
Guru1337
Highly Voted 2 years, 6 months agonbn97
2 years, 5 months agoFer079
2 years, 5 months agoi.eniolaabolade
3 months, 2 weeks agoShalaleh
1 year, 11 months agoShalaleh
1 year, 11 months agoShalaleh
1 year, 11 months agogaikwpa
1 year, 8 months agoSophieeeeee
8 months agolmrod
1 year, 7 months agoTime2excel
1 year, 8 months agoManiula
1 year, 7 months agoManiula
1 year, 7 months agoOGESSIUSER
Highly Voted 2 years, 6 months agoThariCD
2 years, 6 months agohmax56
2 years, 6 months agoNamrata_12
2 years, 5 months agoJahanif
1 year, 2 months agoVGG2001
1 year, 8 months agoVGG2001
1 year, 8 months agoReportingPro
1 year agoOGESSIUSER
2 years, 6 months agoVeroF
2 years, 5 months agocglax
2 years, 2 months agoBiLearn
1 year, 11 months agoSophieeeeee
8 months agoVGG2001
1 year, 8 months agobinny89
Most Recent 1 week agosluo
2 weeks agojaume
3 months, 4 weeks ago539d541
5 months, 3 weeks agoMonsta
6 months, 2 weeks agorcaliandro
7 months agoRayen_BF
7 months agoKiran37
7 months, 3 weeks ago[Removed]
8 months agoFlix
8 months agoTinashe16
9 months, 3 weeks agoCookieMingkee
10 months agoMoneyStacking
10 months, 2 weeks agoVidushi101
11 months, 1 week agoElieG
11 months, 2 weeks ago