HOTSPOT -
You have a table that contains the following three columns:
✑ City
✑ Total Sales
✑ Occupation
You need to create a key influencers visualization as shown in the exhibit. (Click the Exhibit tab.)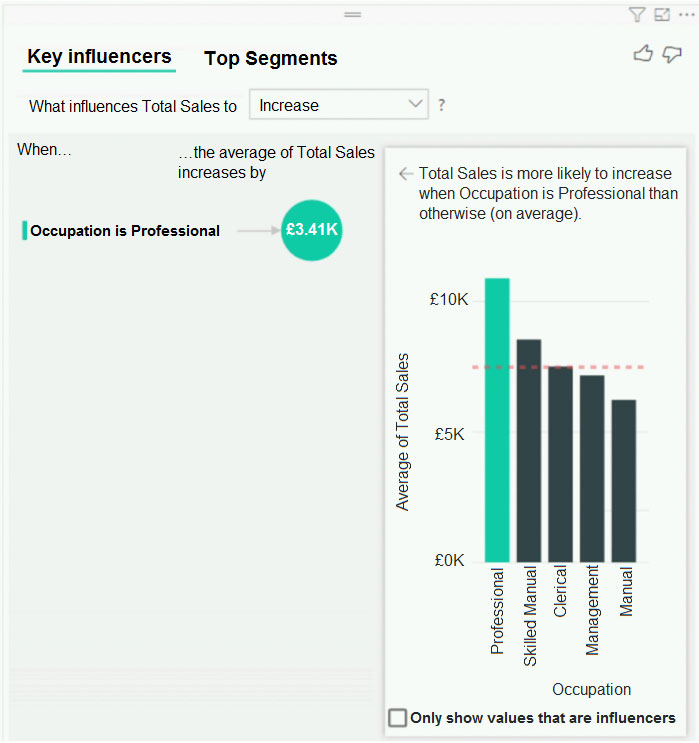
How should you configure the visualization? To answer, select the appropriate options in the answer area.
NOTE: Each correct selection is worth one point.
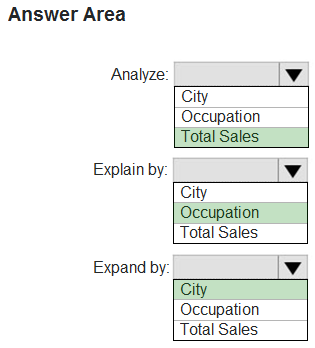
Hot Area: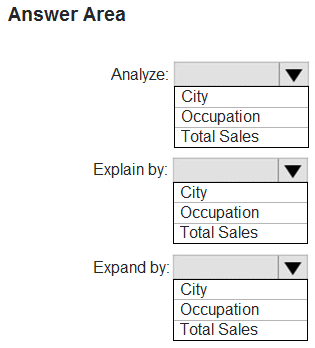

Hermenez
Highly Voted 4 years, 5 months agoashishashokan
3 years, 11 months agoAb5381
4 years, 3 months agoLina90
2 years, 8 months agojerryl
Highly Voted 4 years, 4 months agoBagoo
3 years, 7 months agofumen
Most Recent 2 years, 11 months agoTechDiva
3 years, 1 month agoTechDiva
3 years, 1 month agosyairah86
2 years, 8 months agoscrumbann
3 years, 2 months agoPatrickStr
3 years, 4 months agoALJOHN
3 years, 5 months agokcwood94
3 years, 6 months agoIhueghian
3 years, 6 months agonowwin
3 years, 7 months agomaquint
3 years, 7 months agoUsefJuan
3 years, 8 months agojv2120
3 years, 8 months agoSyndhu
3 years, 10 months agofhqhfhqh
3 years, 11 months agoandimohr
3 years, 9 months agobpxgeek
3 years, 10 months agoEMNAB
4 years, 1 month agoVM_GCP
4 years, 1 month agoCherishworth
4 years agokalyhot
4 years, 2 months agomanlynn
4 years ago