exam questions

Exam 70-778 All Questions

View all questions & answers for the 70-778 exam

Exam 70-778 topic 1 question 87 discussion

Actual exam question from Microsoft's 70-778
Question #: 87
Topic #: 1
[All 70-778 Questions]

You have a table named Sales. A sample of the data in Sales is shown in the following table.

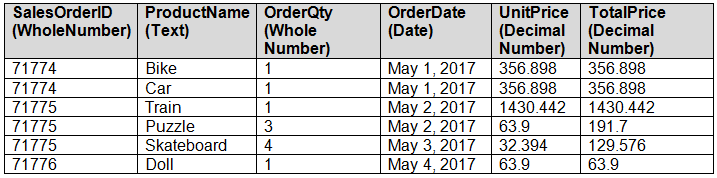
You create a stacked column chart visualization that displays ProductName by Date.
You discover that the axis for the visualization displays all the individual dates.
You need to ensure that the visualization displays ProductName by year and that you can drill down to see ProductName by week and day.
What should you do first?

  • A. Create a new table that has columns for the date, year, week, and day.
  • B. Create a new hierarchy in the Sales table.
  • C. Format the visualization and set the type of the X-Axis to Categorical.
  • D. Configure a visual filter for the Date column that uses an advanced filter.
Show Suggested Answer Hide Answer
Suggested Answer: A 🗳️

Comments

Chosen Answer:
This is a voting comment (?). It is better to Upvote an existing comment if you don't have anything to add.
Switch to a voting comment New
CDL
Highly Voted 4 years, 5 months ago
must be A. 1. create a Date table, including columns: date, week, month, quarter, year. 2. and then create relationship between table "date" and fact table "Sales via [Date]. 3. hierarchy: Y/M/W/D
upvoted 8 times
vishalbhise
8 months, 1 week ago
Option A doesn't have any mention of creating a relationship. How an incomplete option can be answer. Option B says to create a new hierarchy . We can get year,week and day from order date and then create a new hierarchy using these columns.so option B should be correct
upvoted 1 times
...
...
vishalbhise
Most Recent 8 months, 1 week ago
Options no where mention that create a relationship after you create a separate date table. With Option B , you would only need to create one column to identify the week from order date and then create a hierarchy of y/w/d.
upvoted 1 times
...
TONYSOCCER
4 years, 6 months ago
hierarchy would be the second step, no?
upvoted 1 times
...
FakherThabti
4 years, 7 months ago
the answer A is true because there is no week in hierarchy
upvoted 2 times
...
wayneseh217
4 years, 8 months ago
My answer:A. Agreed that week is not autodone, therefore creation a date table is necessary as first thing to do.
upvoted 1 times
...
eug45
4 years, 8 months ago
Wrong 100% Answer is B
upvoted 1 times
...
Ashok025
4 years, 9 months ago
Power BI detects the hierarchy of date as (Day, Month, Quarter & Year). In order to get week, we need to create a custom date dimension table.
upvoted 1 times
...
Delta
5 years, 4 months ago
make only display per week, which is missing, the rest (year, month, day) is automated hierachy in PBI, should be somewhere a button in PBI to intergrate the 4 levels
upvoted 1 times
...
preksha
5 years, 9 months ago
can C be a possible answer, assuming Power BI will auto-detect the date hierarchy from the date field?
upvoted 1 times
RoryHny
5 years, 9 months ago
You need to display it by WEEK, which is not auto-done. So A is the first thing to do
upvoted 22 times
...
...
Community vote distribution
A (35%)
C (25%)
B (20%)
Other
Most Voted
A voting comment increases the vote count for the chosen answer by one.

Upvoting a comment with a selected answer will also increase the vote count towards that answer by one. So if you see a comment that you already agree with, you can upvote it instead of posting a new comment.

SaveCancel
Loading ...
exam
Someone Bought Contributor Access for:
SY0-701
London, 1 minute ago