I would go with B only because all other are totally incorrect. B is not entirly correct because there is no option Percentage under Data Type but under Format:Percentage which is misleading.
I would go with D.
A. Create a calculated column that adds the % symbol to the values. - 100% incorrect
B. From the Modeling tab, change the Data Type to Percentage. - 20% correct. Data Type is not the same as data format. Percentage is format so this should be incorrect.
C. Edit the query of the data source and change the Data Type to Percentage. - 100% incorrect. Tested this option, went to Power Query and changed column values to percentage type, but nothing changed.
D. Create a measure that adds the % symbol to the values. - 80% correct. I created 4 new measures (value, min, max, target) and formatted them as percentage and i get desired view. "Adds the % symbol" is not defined how to add.. if you just add "%" to calculation it will fail, but if you "add" it using format option it works.
Answer is C. There is no option to change datatype in Modelling tab(Option B). A and D is anyways not feasible. Tested Option C. It works : Go to Edit queries(Transform)-> Change the datatype of the column to Percentage. It works.
I think D is the correct answer.
1. In the modelling tab, in Report view, you cannot change the data type.
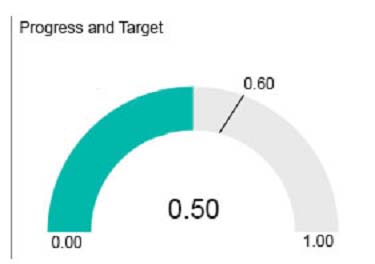
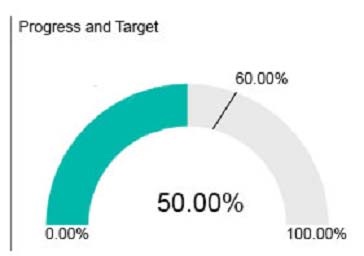
2. In the query editor, if you change the data type, it only adds a % sign. But the required visual should change 0.50 to 50.00%.
3. Obviously this KPI is the result of some measure so fix the calculated measure which is being shown on the KPI card.
But if you changed the Formatting for the measure it will automatically convert 0.50 to 50%, then set decimal to 2 places and you'll have 50.00%. But this is tricky though since you are in the Report View,
I go with B.
Ref Links as below:
https://docs.microsoft.com/en-us/power-bi/visuals/power-bi-visualization-radial-gauge-charts
https://www.youtube.com/watch?v=t2tkaizi4Y4 <-- (3 min 36 sec)
I have to disagree with B as the correct answer. In the context of the question and the below link, C is the most correct answer. I have the most recent version of Power BI Desktop and the Modeling tab does not have the data type option. The easier place to make the change is in the query editor. You can create a measure to do anything you want, but knowing how MS creates their questions and answers they are looking for the most correct answer.
https://docs.microsoft.com/en-us/power-bi/connect-data/desktop-data-types
There are two ways to achieve this:
1. On PBI Desktop, click on your measure and formula will appear > Go to Modelling > Format as %
or
2. Create a measure as : format([Measure Name],"percent")
https://community.powerbi.com/t5/Desktop/how-to-add-sign-to-my-mesure-result/td-p/198571
The answer should be D. Percentage is a format type not data type.
https://youtu.be/t2tkaizi4Y4
There is a % option in a modeling tab. Mentioned and illustration about half way through video....
I'm furloughed and lost file access. So if there's an update, I'm unaware
Thing is..... I found another source that says it's "B". https://community.powerbi.com/t5/Desktop/Percentage-formatting-for-calculated-measures-in-table/td-p/15332
So....I don't know!! (Frustrated b/c both answers are correct but I'll go with the "official" one. Hope it's the right one :/ -- ditto for many other questions!)
This section is not available anymore. Please use the main Exam Page.70-778 Exam Questions
Log in to ExamTopics
Sign in:
Community vote distribution
A (35%)
C (25%)
B (20%)
Other
Most Voted
A voting comment increases the vote count for the chosen answer by one.
Upvoting a comment with a selected answer will also increase the vote count towards that answer by one.
So if you see a comment that you already agree with, you can upvote it instead of posting a new comment.

TiaanR
Highly Voted 5 years, 9 months agoSteveKarr
5 years, 9 months agoKhairul
4 years, 7 months agoRBY10
5 years, 7 months agomirzotti
5 years, 5 months agoHien
Highly Voted 5 years, 8 months agonemanjaandic
Most Recent 4 years, 2 months agoWulalawa
2 years, 9 months agoOompaLoompa
4 years, 3 months agomak47
4 years, 5 months agokyliek7
4 years, 5 months agorr333
4 years, 5 months agoSteviyke
3 years, 11 months agoCDL
4 years, 5 months agoCDL
4 years, 5 months agoThisIsStupid
4 years, 5 months agoTONYSOCCER
4 years, 6 months ago7Zet
4 years, 6 months agoAkshith
4 years, 8 months agoKamel
4 years, 9 months agodivz
4 years, 9 months ago123
4 years, 9 months ago123
4 years, 9 months ago123
4 years, 9 months ago123
4 years, 9 months agor8d1
4 years, 9 months agoNasheM
4 years, 9 months agoShanuramasubbu
4 years, 10 months ago