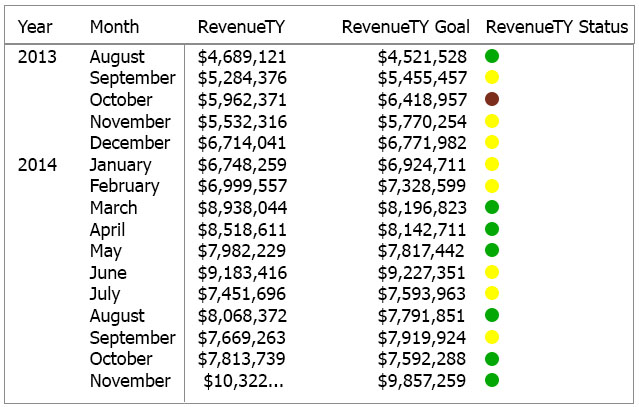
You have a Power Pivot model that includes a KPI. You need to create a visualization based on the Power Pivot model as shown in the exhibit. (Click the Exhibit button.) Which type of visualization should you use?
KPI visual cannot list multiple rows. Only way to achive that is by creating a calculated column to return an image URL, and then adding that to a table. So the correct anwser should be D
Its a tricky question. Ask is not to replicate the visualization but to create one based on it. So if only summary level info is required then KPI is the right answer.
@SteveKarr, try to make a KPI visualization on Power BI, then you compare your KPI with the exhibit proposed on this exercise. This is not a Power BI KPI! This is a Matrix because results are grouped by year, which can only be done with a matrix (a simple table should repeat the year for each row) ---> Answer A
Have to read the question very carefully....It's not asking to create a visual that looks like the model being exhibited. It's asking to create a visual (any visual) that is "based on" the model being exhibited.
Should be A - Matrix.
https://www.biinsight.com/use-kpi-in-table-matrix-and-card-visualisations-in-power-bi/#more-4478
In a Table we will not have empty lines formatting for Year column.
The question stipulates a KPI already exists; it then goes on to state: "You need to create a visualization based on the Power Pivot model as shown in the exhibit. (Click the Exhibit button.)" The model shown lends itself to a matrix.
It should be table, not matrix, because in Matrix if you add second dimension, headers are replaced with many columns each column header with it's value, but here we see two columns headers, so column adds more cols not rows ...so should be table.
The matrix automatically aggregates the data and enables drill down. You can create matrix visuals in Power BI Desktop reports and cross-highlight elements within the matrix with other visuals on that report page. For example, you can select rows, columns, and even individual cells and cross-highlight.
The question states : You need to create a visualization based on the Power Pivot model ....ie KPI and hence KPI seems to be correct answer. It is very tricky question.
To conclude, the answer is certainly Matrix, which is same as Excel PivotTable in PowerBI, but it also has the functionality of conditional formatting.
If this question is for the Excel exam, then the answer is KPI in order to display the conditional formatting like that.
The answer makes my head hurts. It literally tells you what you need to do here:
https://www.biinsight.com/use-kpi-in-table-matrix-and-card-visualisations-in-power-bi/
To meet the requirement of the question "You need to create a visualization based on the Power Pivot Model as shown in the exhibit" - my understanding....make a visual that looks like the exhibit in Power BI. Creating a KPI which is a Card Visual in the Report DOES NOT LOOK LIKE THE EXHIBIT!! I have tested this over and over and over. It doesn't work on the Matrix Visual works. The answer either assumes that I have already put down some form of visual for me to ADD a KPI for a Multi-card visualization. Or there "apparently" is a way for me to create tables and conditional formatting KPIs grouped by Year that I am not aware of...(if so please tell me. I NEED TO KNOW!!). End rant.
"You have a Power Pivot model that includes a KPI" so I should have read this as visualize the KPI from the Power Pivot. Is this testing Power BI or my reading comprehension.
This section is not available anymore. Please use the main Exam Page.70-778 Exam Questions
Log in to ExamTopics
Sign in:
Community vote distribution
A (35%)
C (25%)
B (20%)
Other
Most Voted
A voting comment increases the vote count for the chosen answer by one.
Upvoting a comment with a selected answer will also increase the vote count towards that answer by one.
So if you see a comment that you already agree with, you can upvote it instead of posting a new comment.

AnetaK
Highly Voted 5 years, 9 months agoTiaanR
Highly Voted 5 years, 9 months agoSteveKarr
5 years, 9 months agoRoryHny
5 years, 8 months agoChrislMast
Most Recent 4 years, 2 months agoLhouss
4 years, 4 months agomaybelline_ny
4 years, 5 months agoCDL
4 years, 5 months agoAniee
4 years, 6 months agoda_boston
4 years, 6 months agoRajGoy
4 years, 7 months agoeug45
4 years, 7 months agoPranayPro
4 years, 8 months agoAkshith
4 years, 8 months agoshahatul
4 years, 8 months agopbia
4 years, 9 months agoWyman
4 years, 10 months agoEchicken07
4 years, 10 months agoyf
4 years, 10 months ago