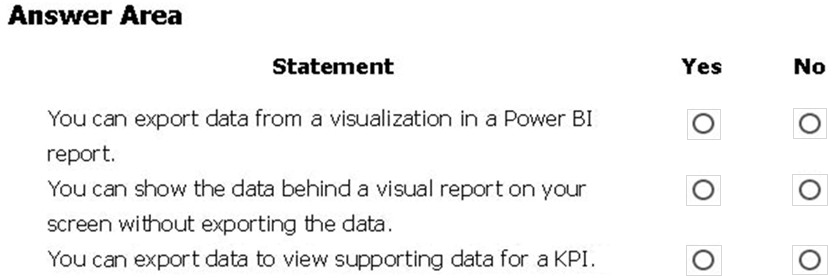
HOTSPOT - You have a Power BI report. For each of the following statements, select Yes if the statement is true. Otherwise, select No. NOTE: Each correct selection is worth one point. Hot Area:
Suggested Answer:
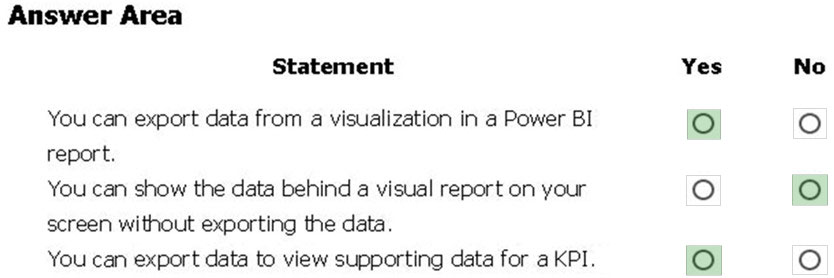
Box 1: Yes - If you'd like to see the data that Power BI uses to create a visualization, you can display that data in Power BI. You can also export that data to Excel as an .xlsx or .csv file. The option to export the data requires a Pro or Premium license and edit permissions to the dataset and report. Note: Export data from a Power BI dashboard 1. Select the ellipsis in the upper-right corner of the visualization. 2. Choose the Export data icon. 3. Power BI exports the data to a .csv file. If you've filtered the visualization, then the app will filter the downloaded data. 4. Your browser will prompt you to save the file. Once saved, open the .csv file in Excel.
Box 2: No - Underlying data: Select this option if you want to see the data in the visual and additional data from the model (see chart below for details). If your visualization has an aggregate, selecting Underlying data removes the aggregate. When you select Export, Power BI exports the data to an .xlsx file and your browser prompts you to save the file. Once saved, open the file in Excel.
Box 3: Yes - A KPI dataset needs to contain goal values for a KPI. If your dataset doesn't contain goal values, you can create them by adding an Excel sheet with goals to your data model or PBIX file. Note: A Key Performance Indicator (KPI) is a visual cue that communicates the amount of progress made toward a measurable goal. Reference: https://docs.microsoft.com/en-us/power-bi/visuals/power-bi-visualization-export-data https://docs.microsoft.com/en-us/power-bi/visuals/power-bi-visualization-kpi
Yes, "If you're interested in seeing behind-the-scenes, the Power BI service lets you display the data that is being used to create a visual in a report. When you select Show as a table, Power BI displays the data below (or next to) the visual." https://docs.microsoft.com/en-us/power-bi/consumer/end-user-show-data
Yes. Visualization can be exported in a PBI report. Example: a report page can be exported as an image.
Yes. Since you create the visualizations in PBI report automatically you can view it there. Common sense.
Yes. You can export data to view the supporting data for a KPI in Power BI.
All answers should be yes
You can show the data behind a visual report on your screen without exporting the data.
Answer: Yes
Explanation: Power BI provides the functionality to see the data behind a visualization directly in the report. By using features like 'Show Data' or 'See Records', you can view the detailed data that is driving a visual without the need to export it.
The 2. is NO, because we can see the SUMMARIZED data in "Show as a table view", but we can't see the raw data behind the visualization without exporting it. Confirmed in official Microsoft practice exam.
i found this on another site. i would also say 3 YES
You have a Power BI report.
For each of the following statements, select Yes if the statement is true. Otherwise, select No.
✅ Yes ⬜ No - You can export data from a visualization in a Power BI report
✅ Yes ⬜ No - You can show the data behind a visual report on your screen without exporting the data
✅ Yes ⬜ No - You can export data to view supporting data for a KPI
When users comment "Verified" they're letting us know that this question is indeed on the exam. There are two things we are expecting when we come to sites like this one:
1. The questions will appear on the exam as they appear here.
2. The answers provided are correct.
While the "Verified" comments don't speak to the second point; they verify the first. It's valuable to know that the questions on this site are legit on the exam. It's not helpful to post an argumentative comment.
This section is not available anymore. Please use the main Exam Page.PL-900 Exam Questions
Log in to ExamTopics
Sign in:
Community vote distribution
A (35%)
C (25%)
B (20%)
Other
Most Voted
A voting comment increases the vote count for the chosen answer by one.
Upvoting a comment with a selected answer will also increase the vote count towards that answer by one.
So if you see a comment that you already agree with, you can upvote it instead of posting a new comment.

Vic_2020
Highly Voted 4 years, 2 months agocatcat567
2 years, 3 months agoZakriya
3 years, 6 months agoyassine70
3 years, 7 months agoyassine70
3 years, 7 months agoGowri_Pokuri
Highly Voted 4 years, 2 months agoNEKO_J
Most Recent 2 months, 1 week agodciferit
10 months agoManiula
1 year, 3 months agorabis
1 year, 8 months agoSHNH
1 year, 9 months agoEltooth
1 year, 11 months agoSammyenroute01
1 year, 11 months agoHN_3532
1 year, 10 months agoKristty
2 years, 5 months agoMElokabi
2 years, 1 month agoContactfornitish
2 years, 6 months agoToli2
2 years, 6 months agoeasport
2 years, 7 months agoDanielPants
2 years, 7 months agohintya
2 years, 9 months agoPraveenGabriel
2 years, 11 months agovtm1
2 years, 9 months agoTapoja
2 years, 8 months agoNks1999
3 years ago