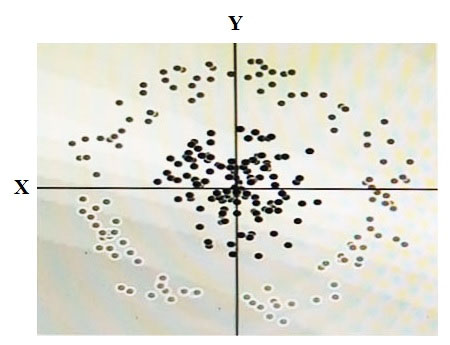

You have some data, which is shown in the graphic below. The two dimensions are X and Y, and the shade of each dot represents what class it is. You want to classify this data accurately using a linear algorithm. To do this you need to add a synthetic feature. What should the value of that feature be?
jvg637
Highly Voted 5 years, 1 month ago[Removed]
Highly Voted 5 years agoSamuelTsch
Most Recent 6 months agobaimus
7 months agoMathew106
1 year, 9 months agoMathew106
1 year, 9 months agosamdhimal
2 years, 3 months agoGCPpro
2 years, 3 months agodesertlotus1211
2 years, 3 months agoAzureDP900
2 years, 3 months agoDipT
2 years, 4 months agoDGames
2 years, 4 months agomvww11
2 years, 10 months agogabrysave
2 years, 11 months agodiagniste
2 years, 12 months agoTanzu
3 years, 2 months agosraakesh95
3 years, 3 months agomoumou
3 years, 3 months agoNR22
2 years, 12 months ago